The interesting
property of Makrolon is the microporous structure, which allows a discrimination
of analytes due to different sizes of the analyte molecules [220]-[222].
Small analytes show a very fast sorption (of the Langmuir type) into the pores,
medium sized analytes slower kinetics and bigger molecules hardly sorb into
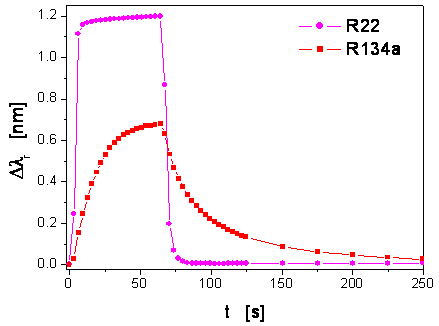
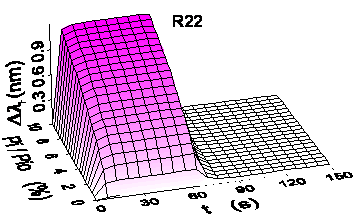
the pores of the polymer. For the two analytes R22 and R134a, the sensor responses
of the SPR device are plotted in figure 20 during
60 seconds of exposure to analyte with a relative saturation pressure pi/pi0 of 0.1 and afterwards during exposure
to synthetic air. The smaller molecules of R22 immediately sorb into the pores
of the polymer and desorb very fast resulting in a rectangular shape of the
sensor response. The bigger molecules of R134a show a slower kinetics resulting
in a curvature of the sensor response. A quantitative correlation of the different
interaction kinetics with the absolute volume of the analyte molecules is difficult,
as different mechanisms play a role. For the diffusion of the molecules within
a microporous polymer, often the kinetic volumes of the molecules are used.
These kinetic volumes can be calculated with the help of the Van-der-Waals parameters,
the critical pressure, the critical temperature, the Lennard-Jones potential
and the Stockmayer potential [223]-[225]. The kinetic volume is 0.120
nm3 for R22 and 0.140 nm3 for R134a. On the other hand, for the
inclusion of the molecules into the pores, the easiest description is the Van-der-Waals
volume, which is 0.048 nm3 for R22 and 0.056 nm3 for R134a.
For the sorption process into the pores, which can be regarded as a combination
of both volumes, the effective volume of the molecules consequently depends
on the thickness of the layer as the path length of diffusion increases with
the thickness of the layer. This effect is exploited for tailoring the kinetics
of a specified analyte by changing the thickness of the sensitive layer
(see section 5.3.3).
figure 20:
SPR sensor responses for 60 seconds of exposure to analyte with a relative saturation
pressure of 0.1 and after that for exposure to air.
For a
quantitative determination of analytes in mixtures, which is based only on the
different kinetics of the analytes, the kinetics has to differ for the complete
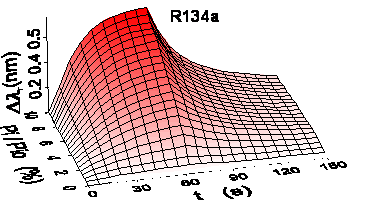
concentration range of interest. In figure 21, the
sensor responses of the sorption of two analytes are plotted versus the time
of sorption (x-axis) and versus the concentration of the
analytes (y-axis). Both analytes
show a linear relationship between the sensor response and the concentration.
In addition, the relationship between the sensor responses and the time of sorption
are also linear for both analytes. The similar shape of the sensor responses
along the time axis means that both analytes cannot be discriminated by the
kinetics although analyte 2 has twice the sensitivity of analyte 1. For example,
the sensor response recorded over time is similar if analyte 1 is present with
a concentration of 0.8 or analyte 2 is present with a concentration of 0.4 rendering
a simultaneous quantification of both analytes impossible. For a successful
discrimination, the sensor responses of the analytes have to show a different
shape along the time axis and not a different slope. In mathematical terms,
the analytes have to show different partial derivates of the second order (twice
derived by time) over the complete concentration range for at least as many
time points as analytes to be quantified:
(24)
With zi as sensor response of the
analyte i and tj as time point j.
figure 21: Linear sensor response
of two analytes for a sorption process versus the concentration and the time.
To test
the feasibility of the quantification of R22 and R134a in mixtures by the use
of only 1 sensor, the sensor responses of the SPR device were time-resolved
recorded for 20 single analyte measurements with relative saturation pressures
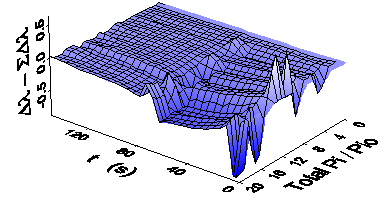
between 0 and 0.1. The sensor responses of these measurements are shown in figure
22. It is obvious that the kinetics of sorption and desorption differs for
both analytes over the complete concentration range enabling the quantitative
determination of both analytes in binary mixtures on the basis of the kinetics
recorded with only 1 single SPR sensor. Thereby the sensor responses at definite
time points are used as input variables for a multivariate calibration. These
time points, which are for example displayed as dots and boxes in figure
20, have also been referred to as "virtual sensor array" in literature.
In contrast to typical setups for chemical sensing, many variables can be generated
by one single sensor and not only 1 variable per sensor. The number of variables
generated depends on the scanning speed (digitization speed) for the recorded
sensor response and on how long the sensor responses are recorded. In contrast
to some approaches, which try to fit a model to the sensor response and which
use the model parameters as input variables, the scanning of the sensor response
allows an accuracy only limited by the sensor recording system, whereas the
model approach often has to deal with lacks of fit or instable parameters.
The time-resolved
approach does not need to wait until an equilibrium state between the analyte
and the analyte sorbed in the polymer has been reached (R22 in contrast to R134a
in figure 22) proposed in static approaches [226]. This allows shorter
measurements and the application of a broader variety of polymers and analytes.
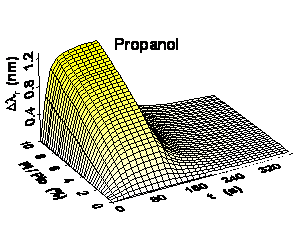
In figure
22 it is also visible that the sensor responses of many time points are
very similar. This means that the variables are highly correlated rendering
the application of simple calibration methods like the MLR useless (see section
2.5).
figure 22:
SPR sensor response during 60 seconds of exposure to analyte and afterwards
during exposure to synthetic air. The x-axis represents the time and the y-axis
represents different relative saturation pressures of the analyte.
The experimental
design of multivariate calibrations highly depends on the interactions of the
analytes in mixtures with the sensitive layer compared to the interactions of
the single analytes with the sensitive layer. A first approach is the assumption
that the sensor responses of the analytes in mixtures are additive of the sensor
responses of the single analytes. In this case, the experimental design only
needs few levels of concentrations for a successful calibration. In figure
23, the sensor responses of the measured binary mixtures of the refrigerants
(both of equal concentrations) minus the sensor responses of the single analytes
of the corresponding concentrations are plotted versus the time and versus the
total concentration of both analytes. It is visible that the plot strongly deviates
from the ideal case of additive signals, which would result in a plane. The
signal during exposure to analyte is lower than expected. This effect reinforces
with higher concentrations of the analytes and can be ascribed to a saturation
of the sensitive layer with analyte. Additionally a faster kinetics directly
after the beginning and after the end of exposure to analyte is visible for
higher concentrations of the analytes. The deviations from the signals being
additive make an extensive calibration like a several-level full factorial design
of the mixtures necessary.
figure 23: Deviations from additive
signals of both analytes when measured in mixtures of equal concentrations of
both analytes.
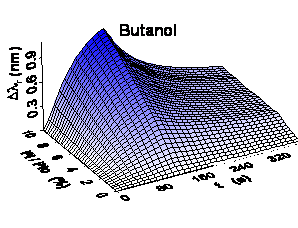
A systematic
variation of the size of the molecules with other molecular properties like
polarity being similar can be found when a homologous series of analytes is
investigated. In figure 24, the sensor responses
of the SPR device are shown for 120 seconds of exposure to analyte of the homologous
series of low alcohols and after that for exposure to air. Similar to the refrigerants,
the shape of the sensor response changes from a rectangular to a wave with an
increasing size of the alcohol molecules. The differences of the sorption and
desorption kinetics should allow the quantification of quaternary mixtures using
only the time resolved measurements of this single SPR sensor.
figure 24:
SPR sensor response during 120 seconds of exposure to analyte and afterwards
during exposure to synthetic air. The x-axis represents the time and the y-axis
represents different relative saturation pressures of the analyte.